Field dispatch
The Machinery
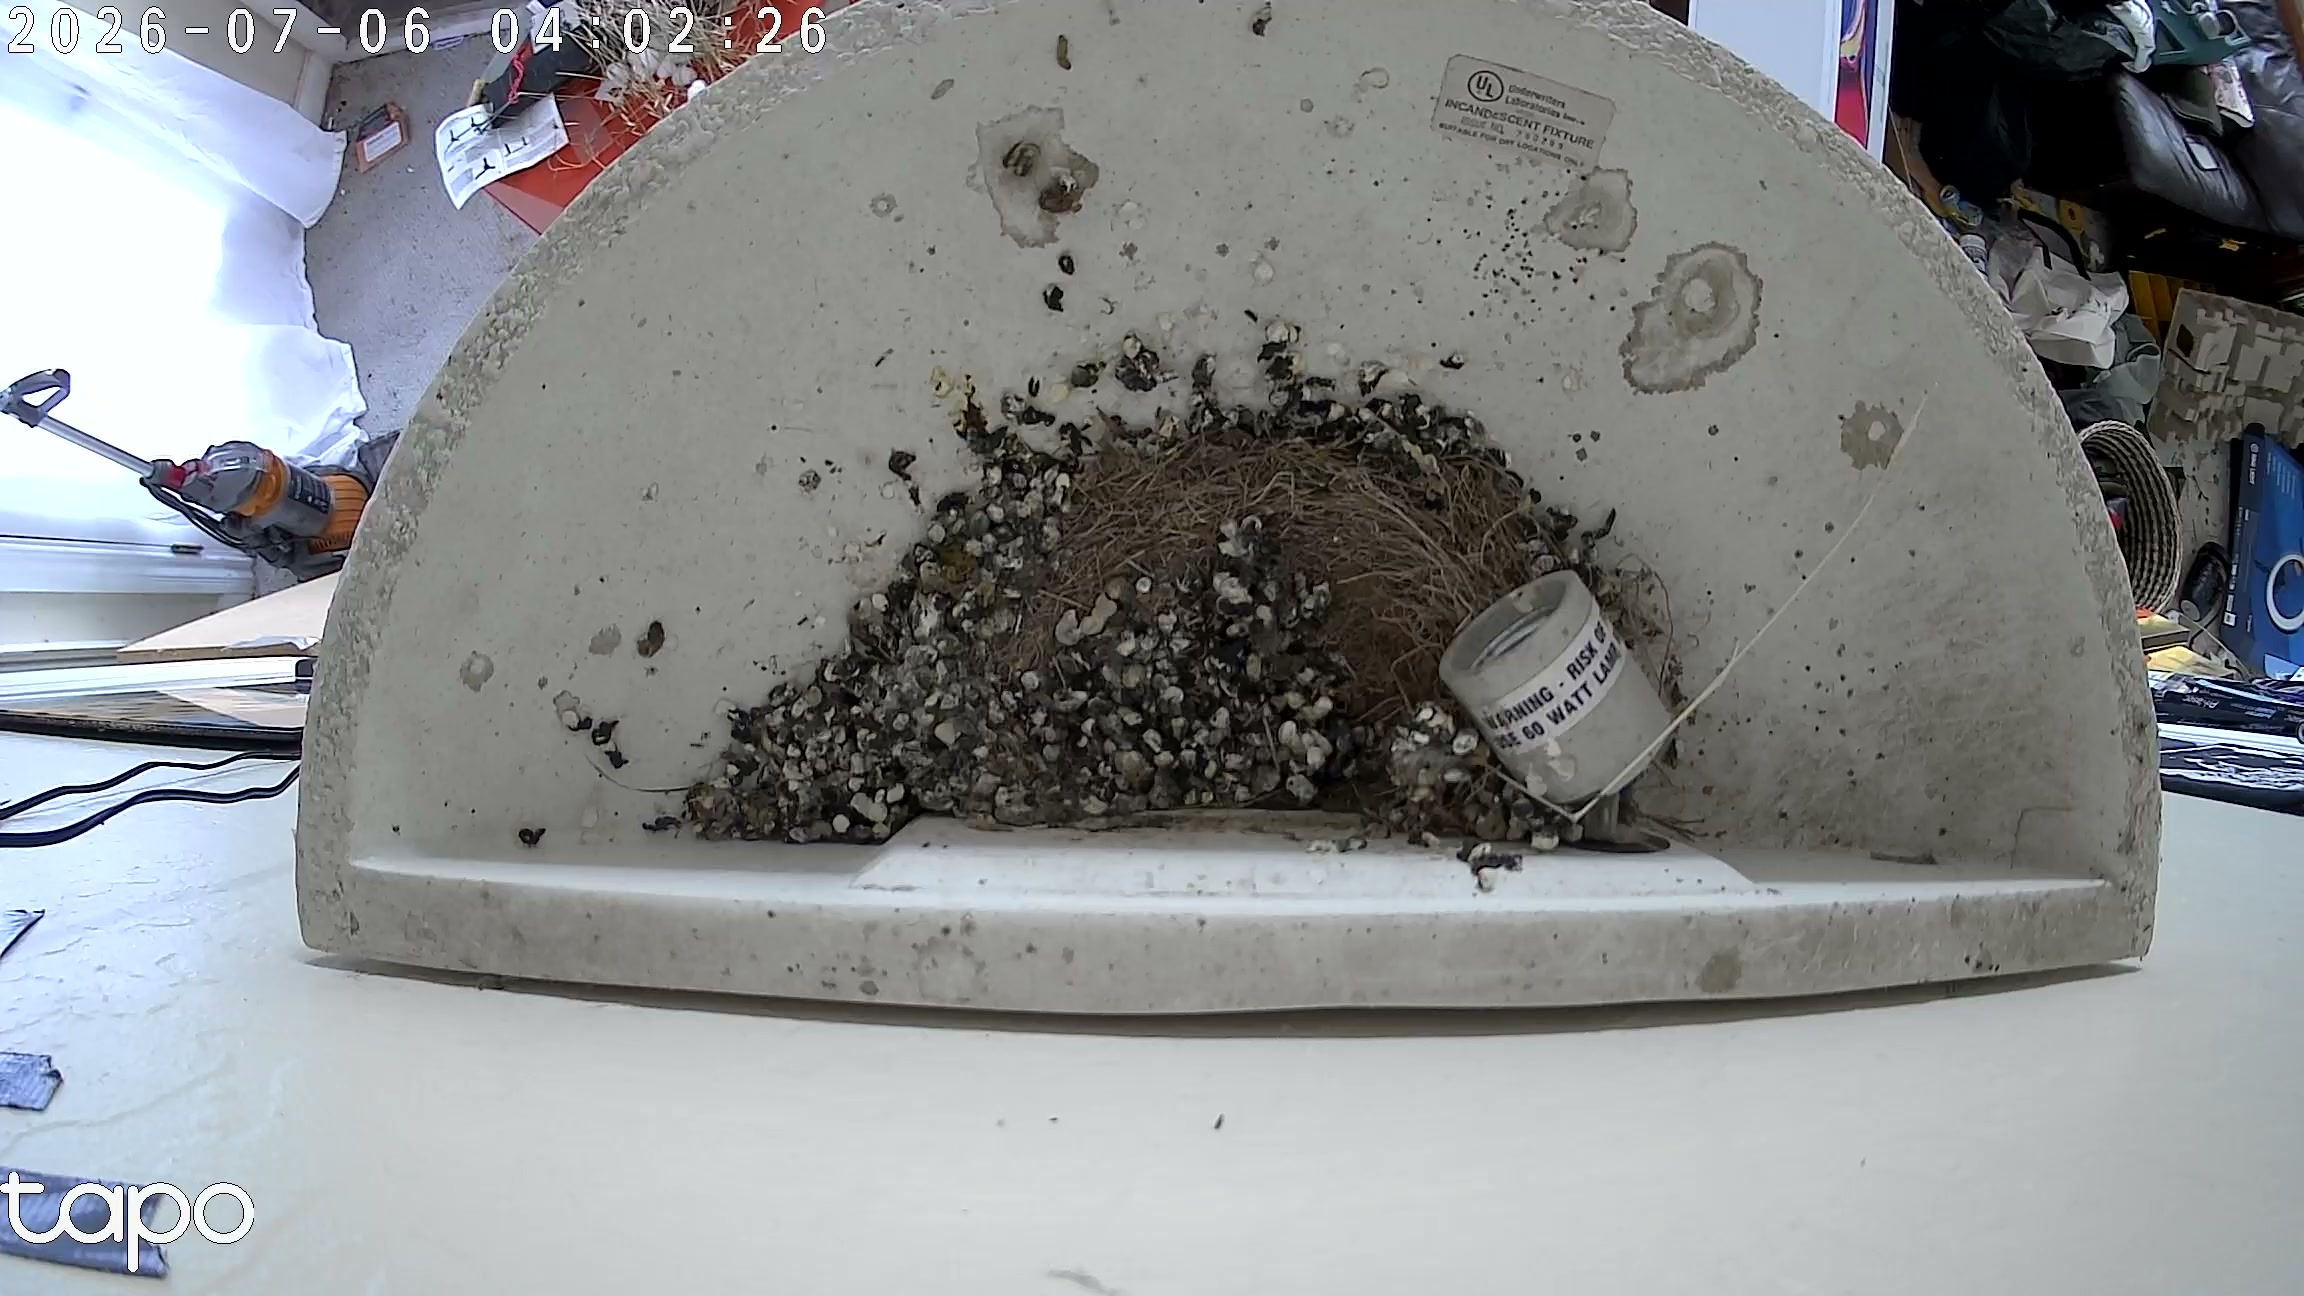
The nest is empty now, so this is a good moment to describe the thing that watched it. Not the birds — the machine. For thirty-eight days a small pipeline ran on a Mac in the next room and turned a camera pointed at a wall sconce into a daily illustrated journal and a page of live-updating charts, with no one driving. This is what it was made of, where it broke, and what it cost.
The shape of it
Three stages, one host. A camera captured short clips to a network drive; a classifier looked at each clip and wrote down what it saw; a publisher turned the day’s records into a post and a set of charts and pushed them to the web. Everything ran on one machine — a Mac called jarvis — as a set of scheduled jobs, about a dozen of them, wired together with launchd and a shared folder of clips. There was no server, no database, no cloud pipeline. The design goal was blunt: it had to run for a month while the house was empty, and heal itself when it could.
Capture
The camera writes a thirty-second clip every thirty seconds — a continuous, gap-free record — over RTSP to the network drive. That is the whole capture layer, and its simplicity is the point: no motion detection to miss an event, no cleverness to break. It just never stops filming.
It arrived at that simplicity the hard way. The original design used the camera’s motion detector — an ONVIF subscription that fired a capture on each event — and for weeks it worked. Then a camera firmware update quietly collapsed the camera’s budget for simultaneous connections, and holding the motion subscription and pulling video at the same time began failing every capture. The daemon caught its own errors and kept going, so nothing crashed and nothing alerted; it just stopped producing footage for a day and a half. The fix was to delete the clever part. The plain interval loop — no motion subscription, just a clip every thirty seconds — has no such conflict, and it became the only capture path. A camera that films everything is harder to break than a camera that decides what’s worth filming.
Classification
Every clip goes to a vision model — Gemini 2.5 Flash — with three frames sampled across its thirty seconds and a carefully bounded prompt: count only what you can clearly see; an adult covering the cup means you did not see the eggs, so report none; a red bird at the nest is a male, and males do not incubate. The model returns structured JSON — how many eggs, how many chicks, which adult, what the cup is doing — and that record is what every chart and every daily post is built from.
The honest thing to say about this layer is that it has a hard ceiling. A wide shot of a cup with a parent sitting in it cannot be counted, no matter how good the model is: the contents are simply behind a bird. Across the whole brooding period the classifier never once counted more than three chicks, though there were plainly four (five, before one was lost). So the counts are published as a floor, not a census, and the true brood size lives in a hand-edited file — brood.toml — that the charts overlay on top of the model’s line. The machine reports what it can see; a human corrects the count when the camera can’t.
That same limit produced the last bug of the run, and it’s a good example of how these systems fail. To keep the brooding weeks honest, the classifier was told that an empty-looking cup during brooding almost always means chicks tucked out of sight, not empty nest — so it labelled those clips “chicks, occluded.” Correct, right up until the morning the chicks actually left. After the fledge that same rule cheerfully labelled six hours of a genuinely empty cup as “chicks, occluded,” and the data page reported a nest full of hidden nestlings that were, in fact, three counties away. The fix was to teach the pipeline the fledge had a time: before it, an empty cup is occlusion; after it, an empty cup is an empty cup. An assumption that is true for the whole middle of a story can still be wrong at its end.
Publishing
Once a day a publisher reads the day’s records, picks the clearest frame for a cover, asks the model for a few sentences of honest narration, regenerates every chart, writes a Markdown post, and deploys the site — Hugo building static pages onto Cloudflare. The daily posts you’ve been reading were, mostly, written this way; the milestone posts — the hatch, the fledge, this one — are hand-written, and the pipeline knows to leave a hand-written post alone.
Static-site publishing has its own small traps, dutifully stepped in and documented. Hugo silently refuses to build a post dated in the future, so a post stamped a few minutes ahead of the build clock simply vanishes. The build directory keeps files the site no longer references, so a deleted page can haunt the live site until the directory is wiped. None of these are interesting; all of them cost an afternoon the first time.
Keeping it alive
The reason it could run unattended is a layer of dead-man’s switches. An hourly watchdog checks that clips are still flowing and restarts capture if they aren’t. A daily “babysitter” job verifies the pipeline actually ran, re-runs it once if it didn’t, and emails a status line every single day — the point of that email being its absence: if it stops arriving, the Mac itself is down.
The hardest failure was the one no watchdog could have caught. Late in June the home network was re-architected, the camera’s subnet moved, the Mac rebooted onto a new address, and the network drive began refusing connections — all at once, while the house was empty. Five days of the record simply don’t exist. There is a post about it, /the-gap/, that says exactly that and invents nothing, and a set of empty labelled slots in the charts where those days should be. The most defensible thing a system like this can do with missing data is leave the hole visible.
What it caught, and what it couldn’t
The whole reason round two existed was to film the front of the cycle that round one arrived too late to see — the building, the laying, the eggs arriving one per morning. It got that, and then it got the other end too: the hatch before dawn on June 17, and the fledge on the morning of July 5, both from the same camera looking down into the same cup.
What it couldn’t do is worth stating plainly, because the temptation is to paper over it. When the four young left, they left one at a time across an hour, and this single wide camera — the only one still running after the outage — could not cleanly capture each individual departure. The birds spent the morning tucked and jostling in the cup, and only the first and the last were caught actually in flight. There was no second camera to cross-cut against. So the fledge post shows the honest version — the count falling four to one across the morning — rather than four look-alike clips pretending to be four departures.
By the numbers
- 38 days, May 29 → July 5, run start to fledge — roughly 159 hours of nest footage
- 19,043 motion clips captured, most of them classified frame by frame
- ~17,500 vision-model classifications persisted (including a backfill of the laying week from footage recovered after the fact)
- ~52,000 frames analyzed (three per clip)
- 34 daily posts published automatically; the milestones hand-written
- ~12 scheduled jobs on one Mac; 0 servers
- 5 days lost to the outage, left visibly blank
- 1 camera at the finish, down from three
- 178 frames with both adults in view, across the whole run
What it cost
Most of the run cost nothing, because most of it ran on hardware and services that were already there. The marginal, run-specific spend was small and lopsided — two line items dominate, and everything else rounds to zero.
- Vision model (Gemini 2.5 Flash) — roughly $15–20. This is the real cost of the run: ~17,500 classification calls, three frames each, plus a few hundred image-ranking calls and one narration call a day. At Flash’s published rates that lands in the mid-teens of dollars; call it under $25 including the re-runs and backfills the persisted count doesn’t capture. (This is an estimate from call volume and token rates, not a pulled invoice.)
- Cloudflare Stream (the live feed) — the one bill still ticking. The live stream has run since July 1 with continuous recording, and stored recording is billed by the minute-month — on the order of a few dollars so far, trending toward ~$30 a month if the recordings are left in place. This is exactly the cost the shutdown addresses: once the run is archived, the recordings come down and the meter stops.
- Cloudflare Pages (the site itself) — $0. Static hosting, comfortably inside the free tier despite a daily deploy for thirty-eight days.
- Compute / electricity — ~$5. One low-power Mac running flat out for thirty-eight days. The hardware was already on the desk; this is just the power.
- The AI that wrote the prose — $0 marginal. The every-third-day literary dispatches ran on an existing Claude subscription, not per-token API billing.
Call the whole run somewhere around $25–50 of actual marginal cost, dominated by the vision calls, with a slow live-video drip that stops the moment we wind the cameras down. For a month of continuous automated wildlife monitoring, published daily to the open web, that is a genuinely cheap way to watch a nest.
The end of the machine
This is the last thing the pipeline will publish. With the birds fledged there is nothing left to film, so the capture jobs, the classifier, the daily publisher, and the live stream are all being switched off, and the recordings archived. The site stays exactly as it is — thirty-eight days of a House Finch cycle, honestly counted, holes and all. The machine did its one job: it was watching when it mattered, at both ends, and it wrote down what it saw.